Hi,
unfortunately I used up all serial ports on my OpenCM 9.04, so I need an alternative means for debugging. The 9.04 has a JTAG/SWD port, so my the question is, has anybody tried this out?
The Arduino IDE 2.0 (which I use more and more recently) has debugging capability and I would love to use it for this.
Thanks in advance for feedback…!
Kai
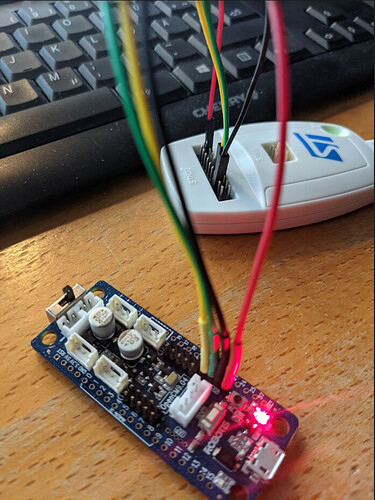
In the meantime I just hooked the board up to a ST-Link debug probe according to the eManual (the pins on the JTAG/SWD port are space only ~1.5mm apart, so I had to shrink-wrap the jumper cables)
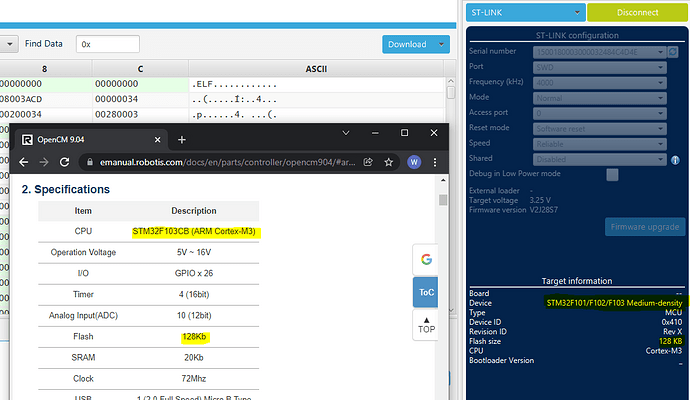
I then “probed” the board with the STM32CubeProgrammer from ST and a least it was recognized correctly:
I have to say I have absolutely now clue about how to proceed from here, so any suggestions are highly appreciated 
Ok, in the meantime I bricked the device (accidentally erasing the flash memory so it did not even show up as a USB device anymore) and so I would like to issue a warning:
WARNING: Playing around with a JTAG/SWD programmer (like the ST-Link) without complete knowledge can break things 
I was able to re-install the bootloader, went through the recovery procedure described here and got back to where I started (and learned by the way that there is obviously a difference between “bootloader” and “firmware”).
This whole JTAG/SWD thing is quite fascinating and I hope to get to a point where I can do debugging in the Arduino IDE 2.0…
It seems I have to shelve the goal of using the Arduino IDE 2.0 for debugging, at least for now… 
Would anyone please correct me if I am wrong: the bootloader seems to set a bit that makes it impossible for the debugger to read the flash memory (I thin it’s called the “readout protection” RDP). This is a possible reason for me bricking the board with the ST-Link probe, since I removed the bit which erased the flash. This is a precaution against hacking into the flash and stealing secrets (like password, user data and so on) which is nice if you sell IoT devices but a little over the edge in a robotics prototype… 
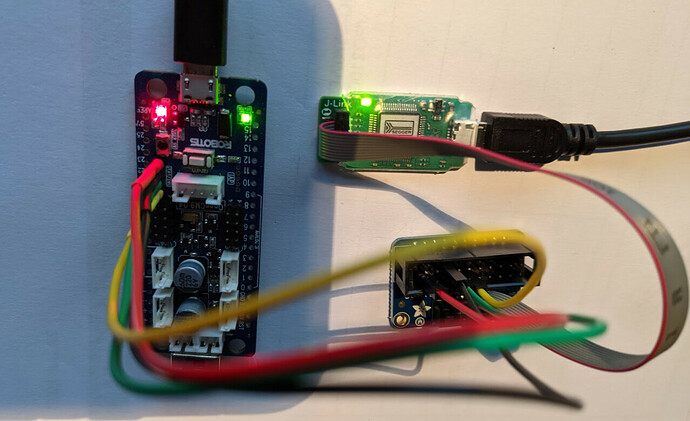
I switched away from the ST-Link probe to some tools that I am more familiar with (Segger J-Link & Ozone)…
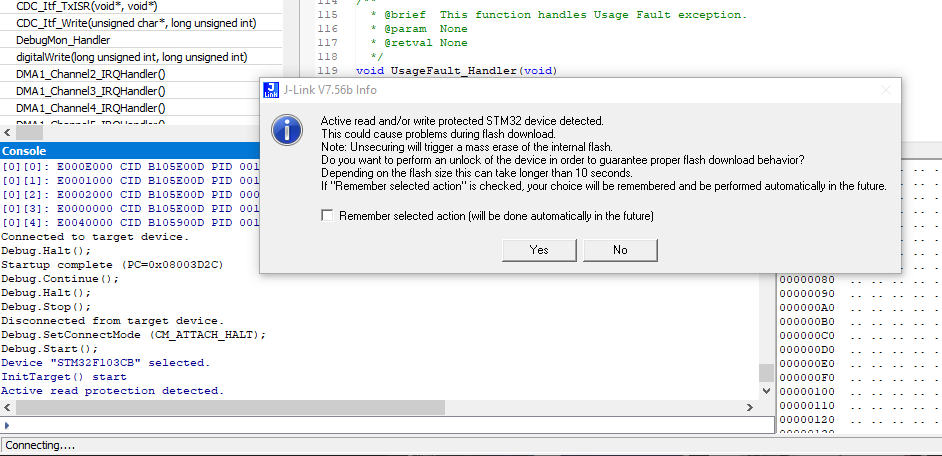
…and, as expected, ran into this…
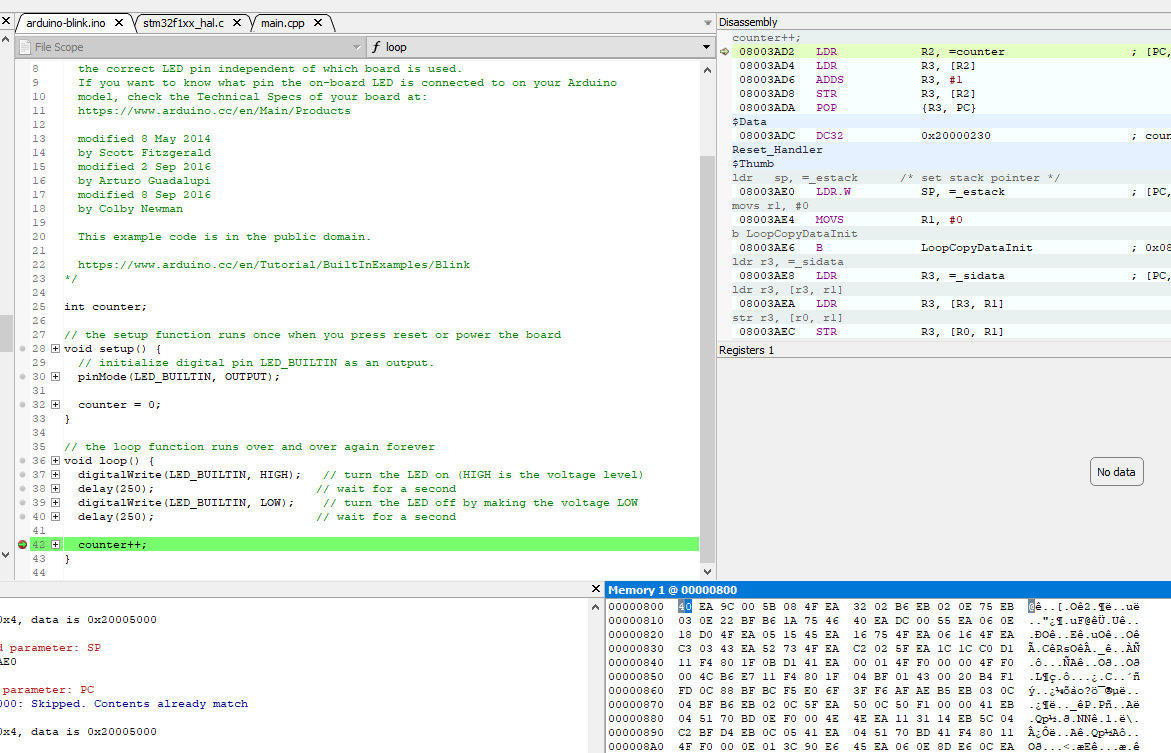
…but finally could upload an easy Blink sketch (both *.bin and *.elf are needed) and ended in the Segger Ozone debugger:
Not the slickest mode to work in, but at least I can see whats going on under the hood…
Strange things are happening, sometimes…
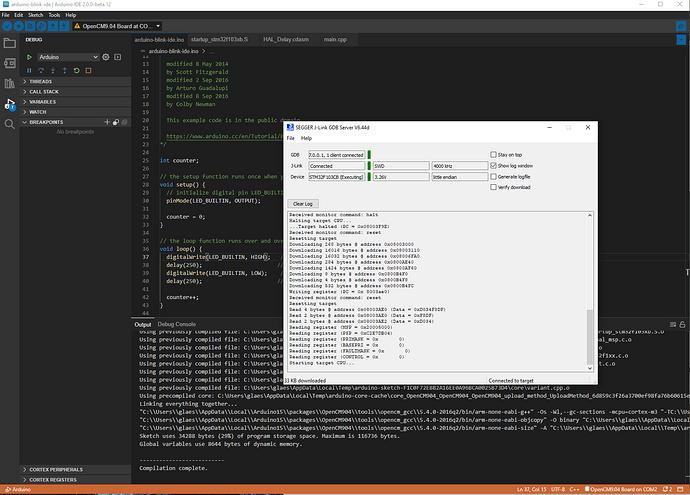
After I got rid of the bootloader (which means uploading all binaries using the J-Link) I can finally debug in the Arduino 2.0 IDE:
The 2.0 IDE is still (very much) in beta, but I think we can be prepared for a huge step upwards regarding capability, absolutely no comparison with the actual 1.8.x version…
